Classification and segmentation results
Observed performance
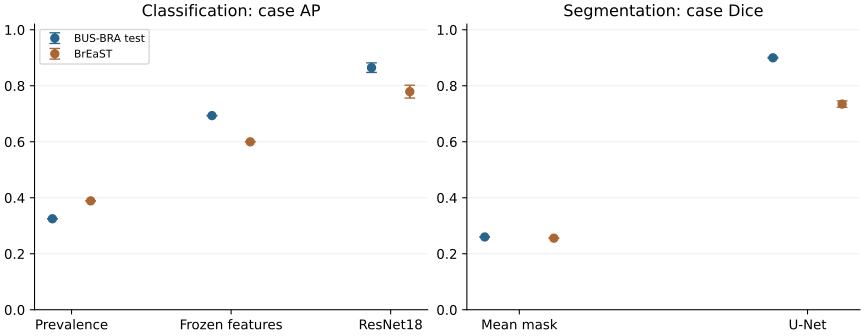
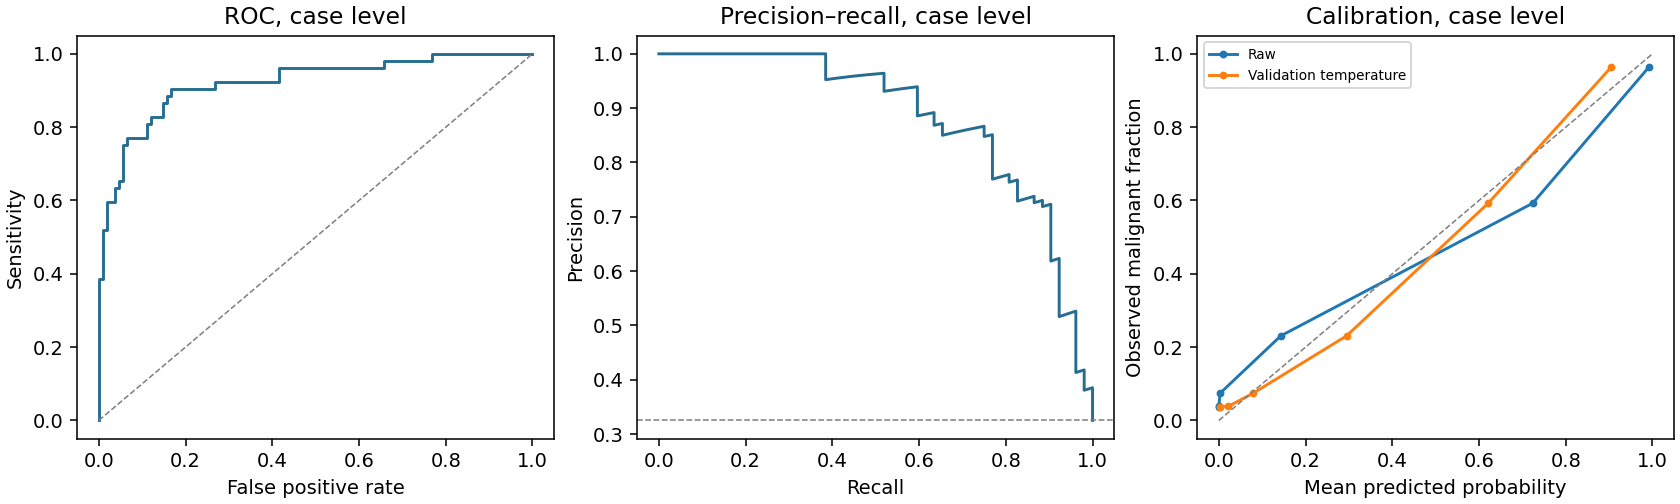
The classifier obtained case AUROC 0.903 ± 0.016 and AP 0.865 ± 0.017 on the BUS-BRA test partition. Frozen ImageNet features with logistic regression obtained AUROC 0.777. The segmenter obtained case Dice 0.900 ± 0.002 and IoU 0.830 ± 0.003.
Neural estimates show mean ± sample standard deviation across seeds 17, 29 and 43. Classification is scored after averaging probabilities within each patient case; segmentation averages native-image scores within a case. The test partition contains 160 cases and 282 images.
1. Classification
| Model | Cohort | AUROC | AP | Sensitivity | Specificity | Brier |
|---|---|---|---|---|---|---|
| Prevalence / mean mask | BUS-BRA test | 0.500 | 0.325 | 1.000 | 0.000 | 0.219 |
| Frozen ResNet18 + logistic regression | BUS-BRA test | 0.777 | 0.693 | 0.577 | 0.907 | 0.166 |
| ResNet18 classifier · 224 px | BUS-BRA test | 0.903 ± 0.016 | 0.865 ± 0.017 | 0.801 ± 0.097 | 0.852 ± 0.056 | 0.128 ± 0.032 |
| Prevalence / mean mask | BrEaST | 0.500 | 0.389 | 1.000 | 0.000 | 0.242 |
| Frozen ResNet18 + logistic regression | BrEaST | 0.679 | 0.600 | 0.255 | 0.909 | 0.266 |
| ResNet18 classifier · 224 px | BrEaST | 0.847 ± 0.013 | 0.779 ± 0.023 | 0.833 ± 0.041 | 0.690 ± 0.026 | 0.220 ± 0.076 |
AP concerns the malignant class. Its prevalence reference is 0.325 on BUS-BRA testing and 0.389 in BrEaST (252 lesion cases). Sensitivity and specificity use each run’s validation-selected Youden threshold. Brier scores use the original probabilities.
2. Segmentation and localization
| Model | Cohort | Dice | IoU | Median Dice | Dice p10 | Box success |
|---|---|---|---|---|---|---|
| Prevalence / mean mask | BUS-BRA test | 0.260 | 0.164 | 0.265 | 0.003 | 0.025 |
| U-Net / ResNet34 · 384 px | BUS-BRA test | 0.900 ± 0.002 | 0.830 ± 0.003 | 0.925 ± 0.002 | 0.810 ± 0.017 | 0.964 ± 0.008 |
| Prevalence / mean mask | BrEaST | 0.256 | 0.164 | 0.228 | 0.000 | 0.048 |
| U-Net / ResNet34 · 384 px | BrEaST | 0.735 ± 0.012 | 0.632 ± 0.011 | 0.840 ± 0.006 | 0.322 ± 0.012 | 0.788 ± 0.037 |
Masks use a fixed probability threshold of 0.5. Box success is the fraction of images with largest-component box IoU ≥0.5, averaged within each case and then across cases. Median and tenth-percentile Dice describe the lower tail of case performance.
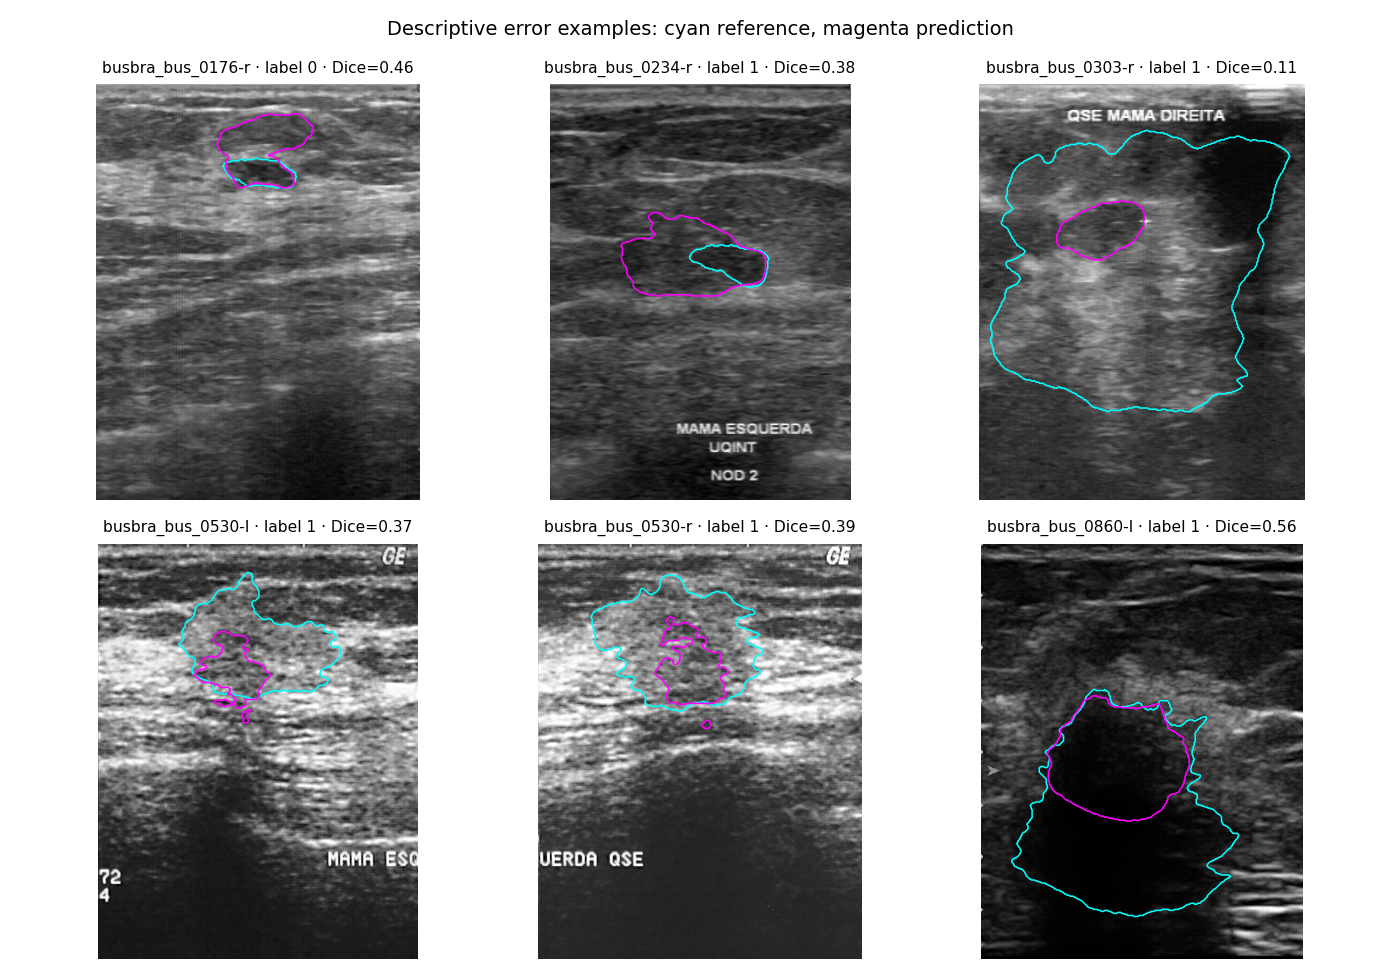
All evaluated images, including other seeds and cohorts, are available in the image explorer. Reference contours can be enabled separately from prediction layers.
3. Model selection and uncertainty
Five configurations were compared on BUS-BRA validation with seed 17. Classification selection maximized case AP; segmentation selection maximized native-resolution case Dice. The selected configurations were then repeated with two additional seeds. Resolution and batch size change together, so this comparison measures complete configurations.
| Candidate | Metric | Epoch | Validation score | Selected |
|---|---|---|---|---|
| classification_224 | ap_case | 17 | 0.902 | yes |
| classification_384 | ap_case | 25 | 0.895 | — |
| segmentation_224 | dice_case | 28 | 0.891 | — |
| segmentation_384 | dice_case | 18 | 0.898 | — |
| segmentation_resnet34_384 | dice_case | 14 | 0.903 | yes |
Patient bootstrap intervals and paired baseline differences use 2,000 case samples. They describe sampling uncertainty conditional on the fitted models. Seed standard deviations describe optimization variability; they are reported separately. Per-seed intervals, threshold-0.5 results, confusion matrices, calibration and subgroups are retained in the full report.
Interpretation and limitations
The experiment evaluates malignancy classification and delineation of lesions in selected images. A box derived from a predicted mask measures localization conditional on lesion presence. It does not assess screening or exhaustive detection of all findings.
One patient split and three seeds give limited information about split variability. Validation is reused for checkpoint and configuration selection, so development scores are optimistic. Case bootstrap intervals condition on the fitted models and validation policy; they exclude model-selection, annotation and threshold uncertainty.
Differences between BUS-BRA and BrEaST may reflect equipment, case composition, image acquisition, annotation and diagnostic verification. These collections have been inspected during project development. Further patient-grouped cross-validation and another independent cohort would be needed to test broader claims.